
Experience a better way of viewing your data with Isologica.
OVERVIEW
DEMOS
PANORAMA
OVERVIEW
QUICK AND EASY DATA UPLOAD
Upload data from Excel files, comma delimited files, and .LAS files with ease. Smart data dictionaries limit the amount of pre-formatting you have to do so you spend less time organizing your data, and more time working with it.
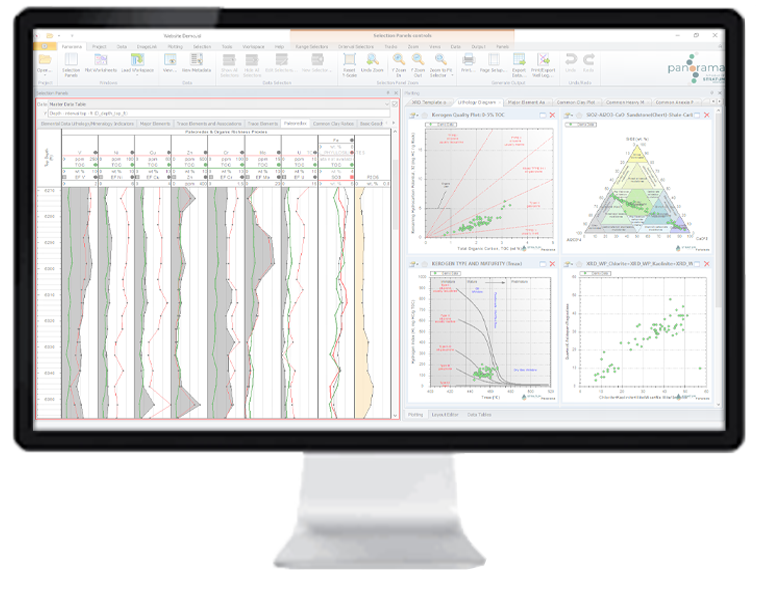
MULTI-SOURCE DATA ANALYSIS
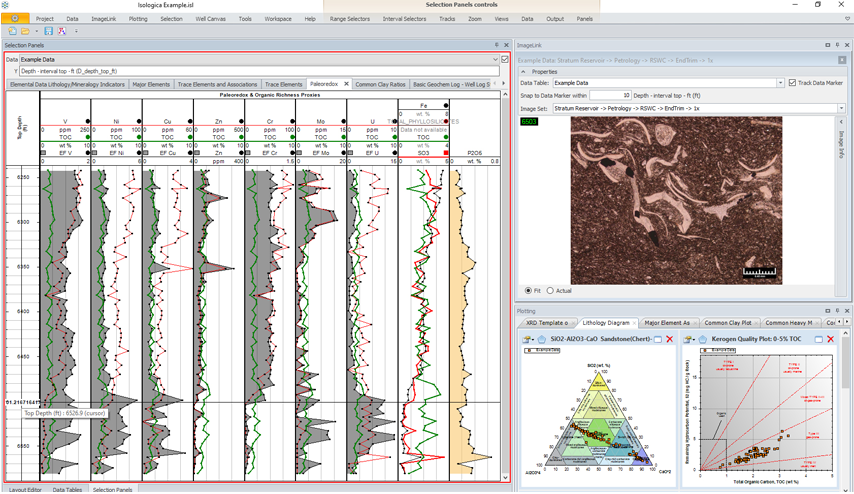
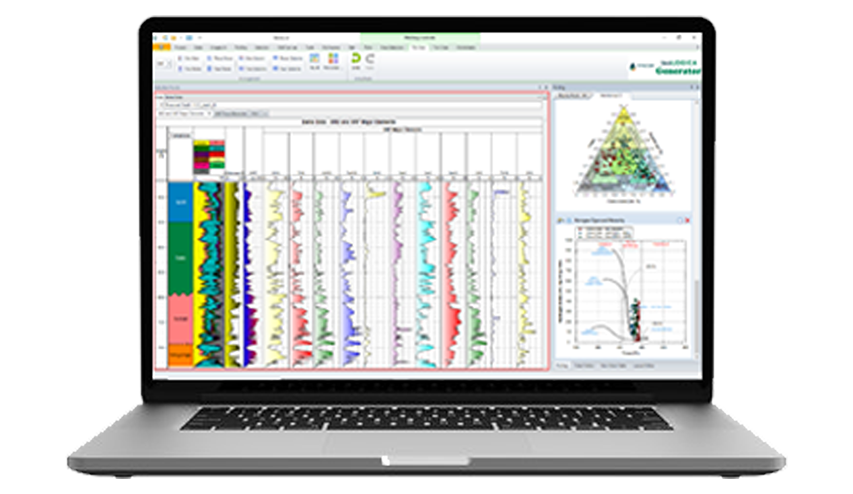
Integrate multiple data sets including log data, point data, and images into a single interface. Get the most out of your data by viewing is all together in one place.
VIEW YOU DATA, YOUR WAY
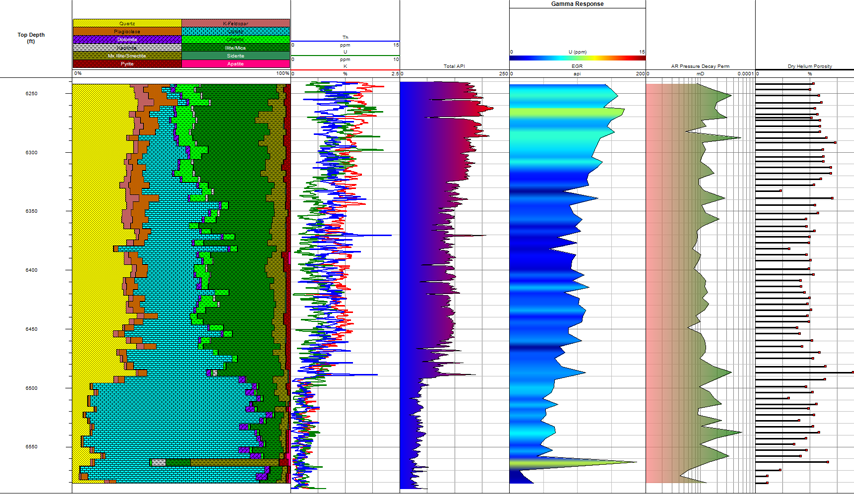
Fully customizable selection panels allow you to view your data how you want. Set thresholds, select areas of interest, and compare data sets from a variety of courses in one location. Get the most out of your data by bringing it together into the big picture.
COMPARE AND ANALYZE
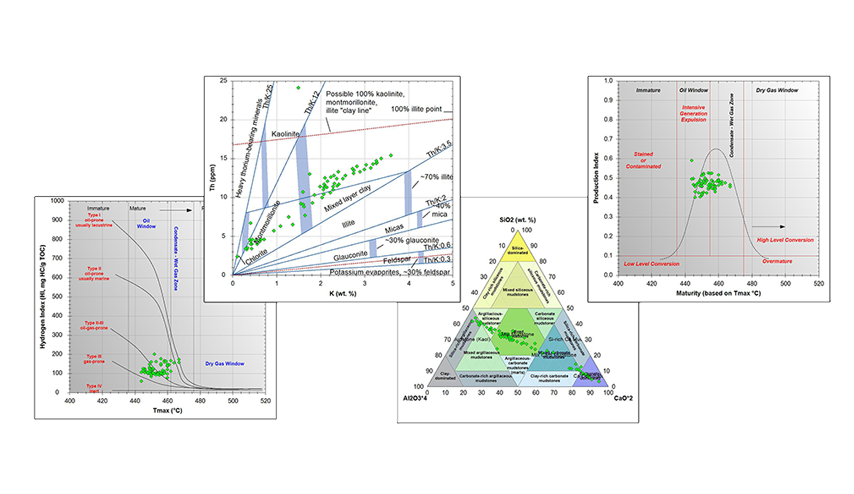
Plot your data in a variety of ways and analyze with built-in plot overlays. Several different plot types allow you to view your different data sets in one location. Area selectors within the plotting tool allow you to select data of interest for further investigation. Get started learning more about your data today.
DEMOS
Welcome to Isologica
A few quick basics on how to use Isologica
How to plot your data in Numeric Tracks and set your threshold for analysis.
How to plot and customize your data using X-Y and Ternary plots as well as using the built-in Plot Overlays.
How to use the Selectors tools in both the Selection Panel and Plotting windows to start analyzing your data.
PANORAMA
Stratum Reservoir’s free Isologica project viewer software
INTEGRATED DATA, DELIVERED
View Isologica projects with our free Panorama viewing software. All of the same stunning visual displays of your project data from Stratum Reservoir in one easy-to-access project file.